Ready for Pilot Testing.
VECTOR has completed its first full adversarial simulation audit. The next milestone: an independently reviewed, offline research pilot.
Pilot scope: offline, shadow-only research. No connection to live public traffic signals.
After nearly a year of development, VECTOR has been evaluated across 36 signalized intersections, 16 traffic scenarios, and 800 held-out simulation trials. The audit establishes a reproducible research baseline, identifies measurable emergency-response improvements against selected baselines, and exposes the control limitations that must be addressed before further validation.
The engineering repository is not public, so there is no source-code link here. Everything needed to check the figures on this page — protocol, results, trial table, evidence and dossier — is published below, byte for byte from audit commit f8e863f.
What the headline means
- VECTOR is ready to be examined by an independent research partner, offline, on historical or simulated data, with VECTOR running in shadow beside an existing controller.
- The audit that supports this is a simulation audit on one synthetic network. Its protocol, trial records, evidence and dossier are published below so the claim can be checked.
What it does not mean
- It does not mean VECTOR is validated for deployment, or safe to connect to public traffic signals.
- It does not mean VECTOR beats standard adaptive control: SUMO’s native actuated controller remains ahead.
- It does not mean a pilot has taken place, or that any university, city or agency has reviewed, endorsed or partnered with the project.
The audit at a glance
What was measured, including what went against VECTOR.
Every result on this page is generated from the audit’s published result files, and the generator fails if the page and the files disagree. Each statement is labelled as verified (measured), a limitation, exploratory, or planned.
- Held-out trials completed
- 800 / 800
- 16 scenarios × 5 controller arms × 10 seeds, run once from the frozen protocol (63bc12a). No trial failed or was retried.Verified
- Scenarios better than fixed-time
- 15 of 16
- Lower mean time loss than a 30 s fixed-time plan, by 84.0–218.5 s per vehicle, with 95% intervals excluding zero. J: −33.4 s, not resolved.Verified
- Scenarios better than native actuated
- 0 of 16
- The strongest baseline stays ahead. After Holm correction VECTOR is significantly worse in B: +73.6 s per vehicle [+26.6, +120.5].Verified
- Faster emergency trips than native
- 39.3–138.0 s
- In 9 of 11 named emergency-vehicle comparisons, with 95% intervals excluding zero. Detection is simulator ground truth.Verified
- Police arrivals in saturated K
- 5 / 10
- Under native control 7 / 10. Signal priority cannot clear downstream gridlock.Current limitation
- Timing violations · illegal states · invalid requests
- 0 · 0 · 0
- In every trial, under the audit harness’s own safety interlock — not VECTOR’s safety governor, which was not in the path.Current limitation
- Scenarios where forecasting loses to persistence
- 15 of 16
- The shadow forecasting stack is worse than repeating the current reading, and it has no influence on control.Verified
- Genuine screenshots, hash-verified
- 27
- 14 sumo-gui captures and 13 dashboard renderings of recorded results.Verified
Project overview
What VECTOR is for, and what was actually tested.
VECTOR investigates adaptive traffic-signal control: signal timing that responds to what each junction observes, rather than to a fixed plan, with the aim of reducing congestion across a network and giving emergency vehicles priority through it.
The vision and the tested implementation are not the same thing, and this release keeps them apart. Only the right-hand column below was evaluated.
The original vision
- An adaptive traffic-signal controller that responds to what it observes at each junction, gives emergency vehicles priority, and stays accountable for every decision.
- A wider named architecture around it: protocol layers (Sentinel, Serpentine, Aegis, Atlas, Punisher, Phoenix, Hyperion, Terminus, Anarchy/ORACLE/PULSAR), perception, routing, coordination, forecasting and learned models.
What the audit tested
- A per-junction, rule-based control law (
control_logic.decide_signals) with four rules in order: emergency override, no-demand rest, a starvation guard at 90 s of red, and vehicle-count priority. A rate-bounded queue observer filters its input. - Signal timing (minimum green 8 s, maximum green 45 s, yellow 3 s, all-red 2 s) enforced by the audit harness’s own safety layer, not by VECTOR’s
SignalSafetyGovernor. - The forecasting and tiered-intelligence stack attached in shadow only: it runs, is scored, and has no path to the signal decision.
- Not in the tested loop at all: routing, coordination between junctions, perception (cameras or detectors), the protocol layers, the learned models and the safety governor. A “Decision Memory Engine” does not exist in the repository.
The HyperCity testbed
36 signalized intersections in a synthetic SUMO grid.
This is a synthetic grid, not a calibrated model of a real city. It has uniform turning rules, two lane counts, Poisson demand from fixed origin–destination classes, and no pedestrians, buses or real counts. It was chosen because no real network with real demand was available. The facts below are read from the network validation report, not assumed.
- Signal-controlled intersections
- 36, connected (strongly connected between controlled junctions)
- Layout
- 6 × 6 grid
- Fringe dead-end nodes
- 24 — not counted as signalized intersections (60 junctions in the file)
- Origin–destination routes
- 552, all 552 legal
- Stop-line detectors
- 192
- Roads, lanes, controlled links
- 168 directed edges, 224 lanes, 480 controlled links
- Simulator
- SUMO 1.28.0 through TraCI, one-second steps
- Validation
- 0 problems; network pinned by canonical hash 8a9ade80bb0d7c06…
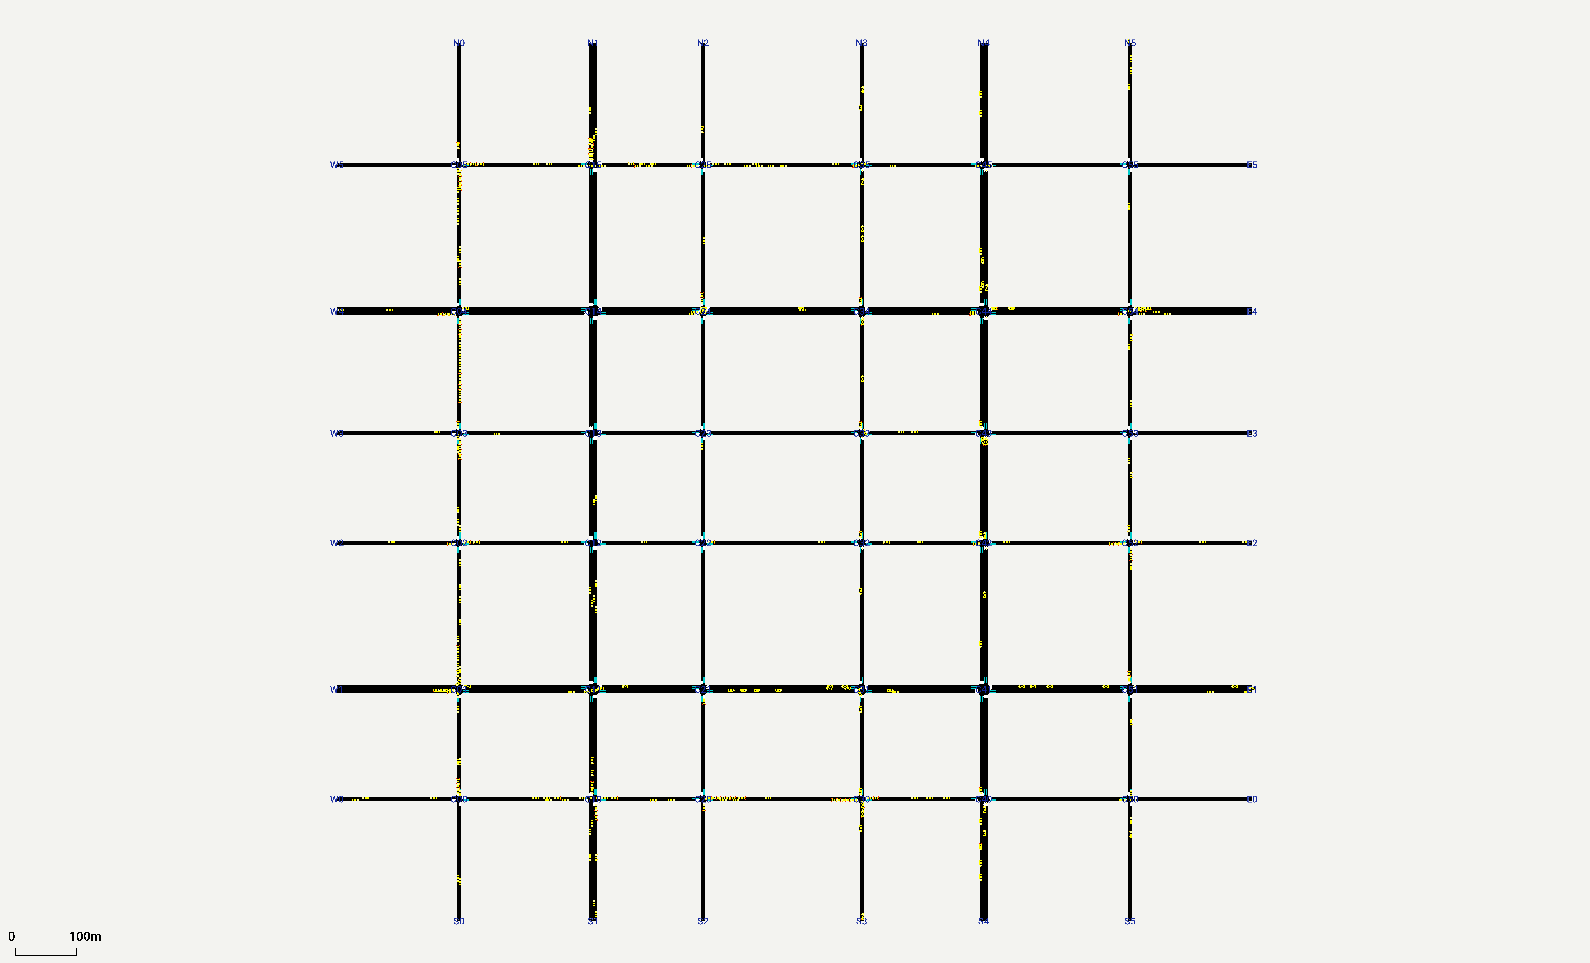
E01city36, all 36 signalised junctions (C00-C55), VECTOR controlling every one, t=301 s
sumo-gui screenshot · scenario A · arm vector · seed 95000 · simulated time 301 s
Full resolution · 1590×963 PNG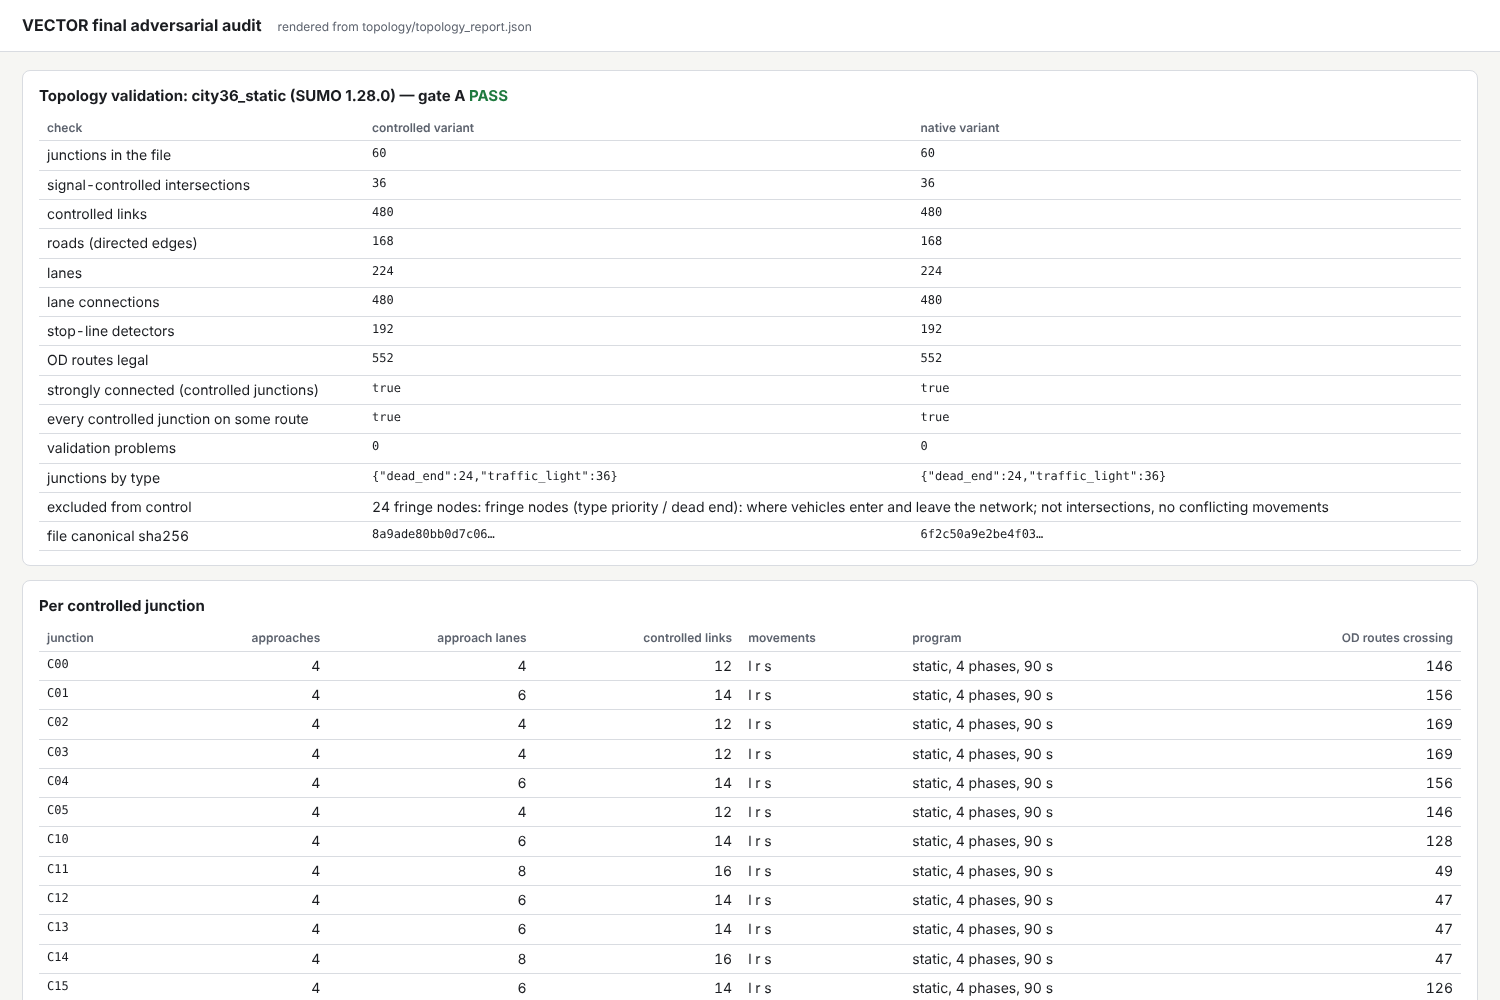
E02Topology validation of city36: 36 signal-controlled intersections, gate A
audit dashboard rendering of recorded results
Full resolution · 1500×1000 PNG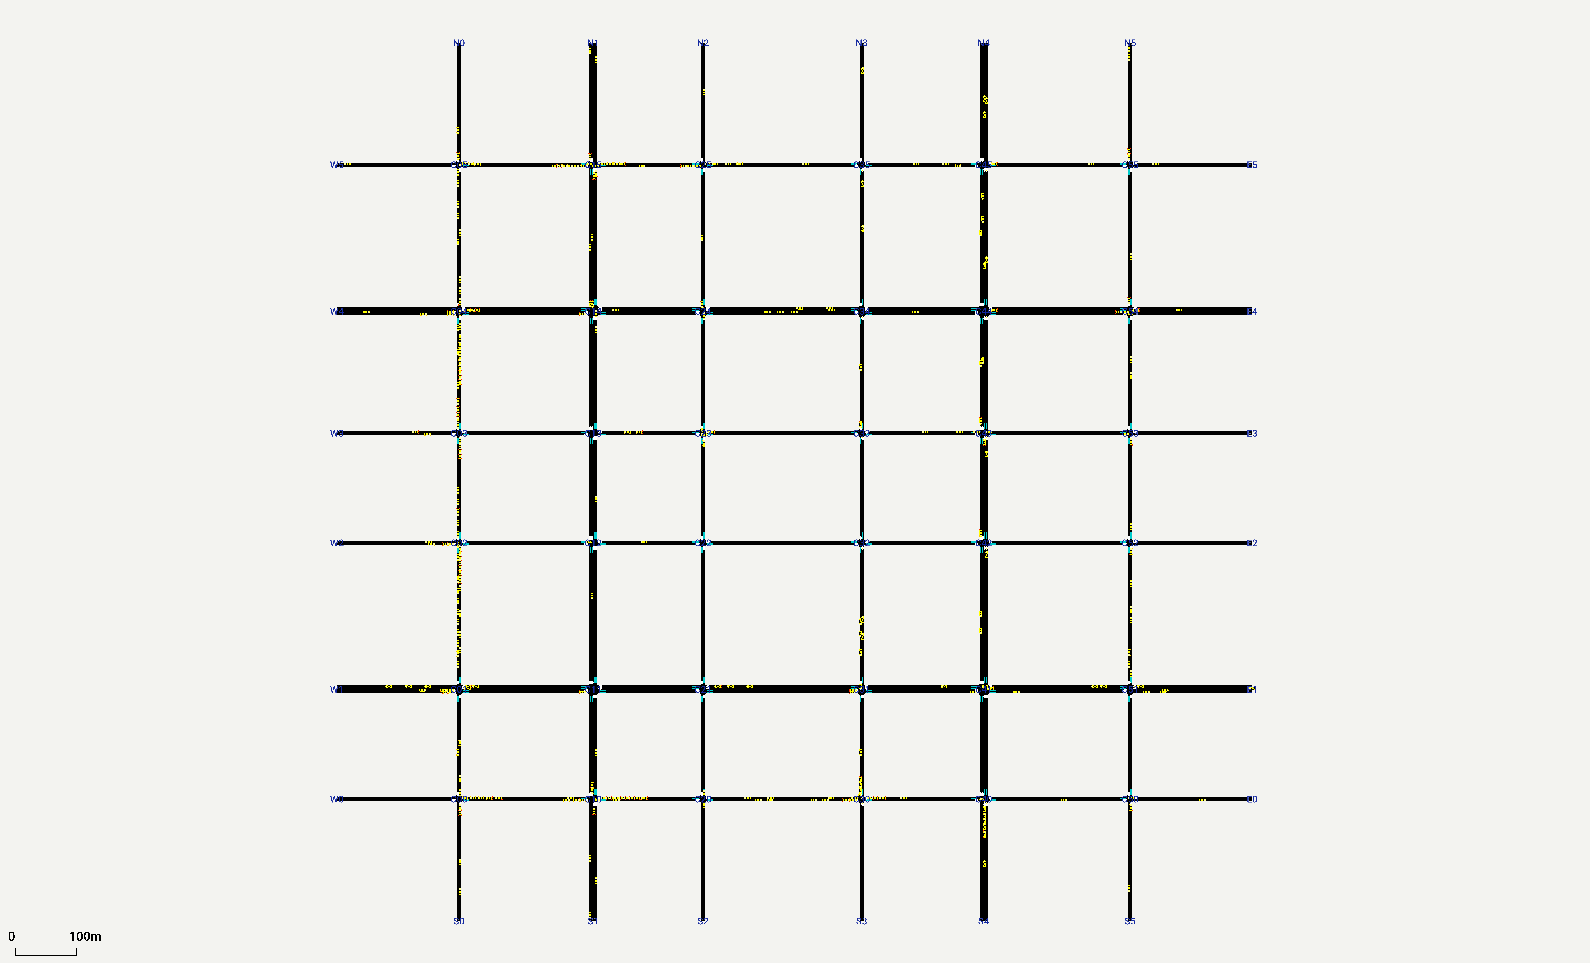
E21reference scenario R0 at 601 s under SUMO's native actuated baseline: the traffic state with no VECTOR and no event
sumo-gui screenshot · scenario R0 · arm native_actuated · seed 95000 · simulated time 601 s
Full resolution · 1590×963 PNGExperimental design
A protocol frozen before the held-out seeds ran.
The protocol, scenarios, controllers, endpoints and statistics were committed at 63bc12a before any held-out seed was run, and the runner refused to start on an uncommitted tree. Ten held-out seeds (95000–95009) were then run once.
What “held-out” means here: the seeds — which fix the random demand and events of each trial — were never used while the scenarios, demand level or harness were being built and calibrated. It does not mean independent cities or real-world deployments: all 800 trials run on the same synthetic network, and each seed is one realisation of each scenario’s random demand.
Scenarios
16 — the reference R0 and adversarial scenarios A–O
Controller arms
5 — VECTOR with its shadow stack, VECTOR without it, SUMO native actuated, a vehicle-actuated rule, fixed-time 30 s
Held-out trials
800 (16 × 5 × 10), all completed; plus 105 smoke trials and 200 post-hoc diagnostic trials on fresh seeds
Pairing
Every arm sees identical demand and events for a given seed, so comparisons are paired by seed
Primary endpoint
Mean time loss per requested ordinary vehicle, in seconds. Vehicles that arrived are charged SUMO’s own time loss; vehicles still running at the end are charged their loss so far; vehicles never inserted are charged the wait since their requested departure. An unfinished trip therefore counts against the controller rather than disappearing.
Statistics
Paired differences (VECTOR − baseline, per seed) with a 95% t-interval and a 95% bootstrap interval (10 000 resamples), the exact Wilcoxon signed-rank test, and Holm correction over the 16 scenarios in two families named in advance: primary, against native actuated control; secondary, against the vehicle-actuated rule. Everything else is exploratory. An interval containing zero is reported as “not resolved”. Ten pairs resolve differences of about one standard deviation of the per-seed difference.
Health gate
Every trial is checked for balanced vehicle accounting, disabled teleporting, SUMO’s reported signal state equalling the commanded state at every step, and timing violations. 799 of 800 passed. The one failure was a baseline — Vehicle-actuated rule in scenario G, seed 95009 — with a SUMO rear-end collision within a lane (not a signal conflict). It reproduces exactly, its SUMO log is published, and it was kept in the analysis.
Seed ranges
Calibration 90000–90001 (baselines only) · smoke 91000–91001 · held-out 95000–95009 · post-hoc diagnostic 96000–96009.
| ID | What is injected | Window (s) |
|---|---|---|
| R0 | reference: base demand, no event | whole run |
| A | sudden demand surge on one corridor (row 1, x4) | 600–1500 |
| B | three simultaneous congestion events in different districts | 600–1500 |
| C | ambulance along the row-1 arterial (6 signalised junctions) | 900–1300 |
| D | ambulance and fire engine converging on C21 from conflicting approaches | 900–1300 |
| E | ambulance, fire engine and police: two crossing conflicts on one corridor | 900–1300 |
| F | unexpected capacity reduction on an arterial (lane blocked, speed 30%) | 700–1500 |
| G | noisy, dropped and phantom observations | 0–2100 |
| H | concept shift: side-street demand x4, arterial x0.4 from 900 s | 900–2100 |
| I | downstream spillback: the arterial exit beyond C31 blocked | 600–1500 |
| J | demand moves from the west half to the east half | 300–2100 |
| K | conflicting objectives: side-street surge, arterial surge, three emergency vehicles | 600–1500 |
| L | stale, delayed, contradictory and invalid observations | 600–1500 |
| M | module degradation: VECTOR's advisory forecasters fail at 900 s, the whole advisory orchestrator at 1500 s | 900–2100 |
| N | recovery after a major disruption clears at 1200 s | 1200–2100 |
| O | combined stress: corridor surge, downstream blockage, ambulance + fire engine, shifting capacity cut | 600–1700 |
Results · against fixed-time control
Better than a 30-second fixed-time plan in 15 of 16 scenarios.
In 15 scenarios VECTOR’s mean time loss was lower than fixed-time control’s by 84.0 to 218.5 seconds per vehicle, with 95% intervals that exclude zero. In scenario J the estimate also favours VECTOR (−33.4 s per vehicle) but its interval, [−81.3, +14.5], includes zero, so J is not resolved.
These are differences in mean time loss per vehicle — delay against free-flow travel — not trip durations and not percentages. This comparison was exploratory in the protocol: fixed-time control is the weakest baseline here, and beating it shows VECTOR is a working adaptive controller, not that it is a good one. No overall average across scenarios is given, because the scenarios are different conditions and an average of them is not a quantity the audit measured.
VECTOR minus fixed-time control, by scenario
VECTOR − fixed-time 30 s · mean time loss per requested vehicle (s) · dot = paired mean difference · bar = 95% t-interval · n = paired seeds · left of zero = VECTOR lower
| Scenario | VECTOR (s) | Baseline (s) | Difference (s) | 95% CI (t) | Seeds better / worse | Wilcoxon p | At 95% |
|---|---|---|---|---|---|---|---|
| R0 | 170.0 | 382.2 | −212.2 | [−260.9, −163.5] | 10 / 0 | 0.002 | VECTOR better |
| A | 330.1 | 455.1 | −125.1 | [−152.1, −98.1] | 10 / 0 | 0.002 | VECTOR better |
| B | 314.7 | 477.9 | −163.1 | [−220.6, −105.6] | 10 / 0 | 0.002 | VECTOR better |
| C | 173.8 | 375.4 | −201.6 | [−249.7, −153.4] | 10 / 0 | 0.002 | VECTOR better |
| D | 175.6 | 369.4 | −193.8 | [−247.7, −139.9] | 10 / 0 | 0.002 | VECTOR better |
| E | 173.4 | 367.6 | −194.2 | [−247.1, −141.3] | 10 / 0 | 0.002 | VECTOR better |
| F | 174.1 | 387.3 | −213.2 | [−258.1, −168.3] | 10 / 0 | 0.002 | VECTOR better |
| G | 163.6 | 382.2 | −218.5 | [−263.3, −173.8] | 10 / 0 | 0.002 | VECTOR better |
| H | 458.1 | 565.5 | −107.4 | [−141.5, −73.3] | 10 / 0 | 0.002 | VECTOR better |
| I | 242.7 | 388.2 | −145.5 | [−217.1, −73.8] | 9 / 1 | 0.006 | VECTOR better |
| J | 591.8 | 625.2 | −33.4 | [−81.3, +14.5] | 8 / 2 | 0.160 | Not resolved |
| K | 453.1 | 537.0 | −84.0 | [−113.9, −54.0] | 10 / 0 | 0.002 | VECTOR better |
| L | 187.6 | 382.2 | −194.6 | [−245.7, −143.4] | 10 / 0 | 0.002 | VECTOR better |
| M | 170.0 | 382.2 | −212.2 | [−260.9, −163.5] | 10 / 0 | 0.002 | VECTOR better |
| N | 292.3 | 447.6 | −155.3 | [−201.6, −108.9] | 10 / 0 | 0.002 | VECTOR better |
| O | 326.5 | 455.0 | −128.5 | [−207.5, −49.5] | 8 / 2 | 0.010 | VECTOR better |
Mean time loss per requested ordinary vehicle, seconds; 10 paired seeds per scenario. “At 95%” is the unadjusted t-interval. Bootstrap intervals agree and are in comparisons.json.
Results · against SUMO’s native actuated control (primary)
The strongest baseline remains ahead.
VECTOR did not demonstrate a significant improvement over SUMO’s native actuated controller in any of the 16 scenarios. After Holm correction it was significantly worse in scenario B: 314.7 against 241.2 seconds per vehicle, a difference of +73.6 s [+26.6, +120.5], Holm-adjusted p = 0.031, worse on 10 of 10 seeds.
Before correction its interval also lies above zero in C, D, H, J, K, O; 9 scenarios are not resolved. Point estimates favour VECTOR in R0, G, I, M, and none of those is resolved. On fresh seeds after the evaluation, the direction repeats, and the size of the B effect shrinks (see the post-hoc diagnosis below).
Native actuated control is SUMO’s own gap-out programme with minimum and maximum green matched to VECTOR’s adapter. It is the strongest controller in this audit.
VECTOR minus SUMO native actuated control, by scenario (primary family)
VECTOR − native actuated · mean time loss per requested vehicle (s) · dot = paired mean difference · bar = 95% t-interval · n = paired seeds · left of zero = VECTOR lower
| Scenario | VECTOR (s) | Baseline (s) | Difference (s) | 95% CI (t) | Seeds better / worse | Wilcoxon p | Holm p | At 95% |
|---|---|---|---|---|---|---|---|---|
| R0 | 170.0 | 182.0 | −12.0 | [−69.9, +46.0] | 4 / 6 | 0.922 | 1.000 | Not resolved |
| A | 330.1 | 302.6 | +27.5 | [−22.8, +77.7] | 4 / 6 | 0.275 | 1.000 | Not resolved |
| B | 314.7 | 241.2 | +73.6 | [+26.6, +120.5] | 0 / 10 | 0.002 | 0.031 | VECTOR worse |
| C | 173.8 | 140.7 | +33.1 | [+16.3, +49.8] | 1 / 9 | 0.004 | 0.059 | VECTOR worse |
| D | 175.6 | 146.2 | +29.4 | [+12.7, +46.2] | 1 / 9 | 0.006 | 0.076 | VECTOR worse |
| E | 173.4 | 173.1 | +0.3 | [−57.7, +58.3] | 2 / 8 | 0.432 | 1.000 | Not resolved |
| F | 174.1 | 162.1 | +11.9 | [−26.8, +50.7] | 3 / 7 | 0.322 | 1.000 | Not resolved |
| G | 163.6 | 182.0 | −18.3 | [−73.4, +36.7] | 5 / 5 | 0.846 | 1.000 | Not resolved |
| H | 458.1 | 406.9 | +51.2 | [+19.9, +82.5] | 2 / 8 | 0.010 | 0.117 | VECTOR worse |
| I | 242.7 | 258.9 | −16.2 | [−65.6, +33.3] | 4 / 6 | 0.770 | 1.000 | Not resolved |
| J | 591.8 | 522.7 | +69.1 | [+7.0, +131.2] | 2 / 8 | 0.037 | 0.371 | VECTOR worse |
| K | 453.1 | 341.8 | +111.2 | [+67.5, +154.9] | 1 / 9 | 0.004 | 0.059 | VECTOR worse |
| L | 187.6 | 182.0 | +5.7 | [−55.0, +66.3] | 3 / 7 | 0.375 | 1.000 | Not resolved |
| M | 170.0 | 182.0 | −12.0 | [−69.9, +46.0] | 4 / 6 | 0.922 | 1.000 | Not resolved |
| N | 292.3 | 290.8 | +1.5 | [−56.3, +59.4] | 4 / 6 | 0.922 | 1.000 | Not resolved |
| O | 326.5 | 261.5 | +65.1 | [+11.5, +118.6] | 1 / 9 | 0.027 | 0.301 | VECTOR worse |
Mean time loss per requested ordinary vehicle, seconds; 10 paired seeds per scenario. “At 95%” is the unadjusted t-interval; the Holm column is the family-wise test. Bootstrap intervals agree and are in comparisons.json.
Secondary family
Against a simple vehicle-actuated rule
No difference survives Holm correction. Before correction VECTOR is better in R0, A, G, J, L, M, N and worse in K. The rule starves approaches (its longest red waits run to hundreds of seconds); VECTOR’s starvation guard prevents that, at the price of longer reds than native control.
| Scenario | VECTOR (s) | Baseline (s) | Difference (s) | 95% CI (t) | Seeds better / worse | Wilcoxon p | Holm p | At 95% |
|---|---|---|---|---|---|---|---|---|
| R0 | 170.0 | 194.9 | −24.9 | [−47.3, −2.6] | 8 / 2 | 0.049 | 0.537 | VECTOR better |
| A | 330.1 | 391.7 | −61.6 | [−104.8, −18.4] | 9 / 1 | 0.004 | 0.062 | VECTOR better |
| B | 314.7 | 357.0 | −42.3 | [−105.3, +20.7] | 5 / 5 | 0.322 | 1.000 | Not resolved |
| C | 173.8 | 183.2 | −9.4 | [−26.5, +7.8] | 7 / 3 | 0.232 | 1.000 | Not resolved |
| D | 175.6 | 184.5 | −8.8 | [−28.0, +10.3] | 6 / 4 | 0.432 | 1.000 | Not resolved |
| E | 173.4 | 185.5 | −12.1 | [−34.3, +10.1] | 7 / 3 | 0.275 | 1.000 | Not resolved |
| F | 174.1 | 188.0 | −13.9 | [−42.3, +14.4] | 7 / 3 | 0.232 | 1.000 | Not resolved |
| G | 163.6 | 183.9 | −20.2 | [−39.7, −0.8] | 8 / 2 | 0.064 | 0.580 | VECTOR better |
| H | 458.1 | 480.7 | −22.6 | [−56.6, +11.4] | 6 / 4 | 0.275 | 1.000 | Not resolved |
| I | 242.7 | 242.2 | +0.5 | [−54.0, +55.0] | 7 / 3 | 0.322 | 1.000 | Not resolved |
| J | 591.8 | 719.0 | −127.3 | [−186.7, −67.8] | 9 / 1 | 0.004 | 0.062 | VECTOR better |
| K | 453.1 | 417.5 | +35.6 | [+6.2, +64.9] | 2 / 8 | 0.027 | 0.328 | VECTOR worse |
| L | 187.6 | 230.6 | −42.9 | [−60.3, −25.6] | 9 / 1 | 0.004 | 0.062 | VECTOR better |
| M | 170.0 | 194.9 | −24.9 | [−47.3, −2.6] | 8 / 2 | 0.049 | 0.537 | VECTOR better |
| N | 292.3 | 388.2 | −95.9 | [−154.2, −37.6] | 8 / 2 | 0.010 | 0.127 | VECTOR better |
| O | 326.5 | 372.1 | −45.5 | [−132.8, +41.7] | 5 / 5 | 0.375 | 1.000 | Not resolved |
Mean time loss per requested ordinary vehicle, seconds; 10 paired seeds per scenario. “At 95%” is the unadjusted t-interval; the Holm column is the family-wise test. Bootstrap intervals agree and are in comparisons.json.
Results · emergency vehicles
Large reductions in several scenarios, and one failure under saturation.
Named emergency vehicles were dispatched in scenarios C, D, E, K and O. The table gives mean travel time in seconds for each arm, arrivals out of 10 runs, and VECTOR’s paired difference from native actuated control with its 95% interval.
Critical limitation: emergency detection is the simulator’s ground truth, with no missed or false detections — not a validated real-world detection system. Ordinary vehicles do not yield; only the signals help. The general-traffic cost of the overrides is not separately resolved.
| Scenario | Vehicle | Route | VECTOR | Native | Veh.-actuated | Fixed-time | VECTOR − native [95% CI] | n pairs | At 95% |
|---|---|---|---|---|---|---|---|---|---|
| C | Ambulance | W1→E1 | 121.310/10 | 167.810/10 | 191.310/10 | 226.710/10 | −46.5 [−62.1, −30.9] | 10 | VECTOR better |
| D | Ambulance | W1→E1 | 126.310/10 | 168.310/10 | 196.910/10 | 226.510/10 | −42.0 [−54.1, −29.9] | 10 | VECTOR better |
| D | Fire engine | S2→N2 | 138.410/10 | 204.110/10 | 209.310/10 | 277.610/10 | −65.7 [−87.5, −43.9] | 10 | VECTOR better |
| E | Ambulance | W1→E1 | 126.810/10 | 170.610/10 | 194.210/10 | 226.710/10 | −43.8 [−59.4, −28.2] | 10 | VECTOR better |
| E | Fire engine | S2→N2 | 138.610/10 | 205.310/10 | 207.610/10 | 298.710/10 | −66.7 [−87.8, −45.6] | 10 | VECTOR better |
| E | Police car | S4→N4 | 110.710/10 | 150.010/10 | 152.210/10 | 212.710/10 | −39.3 [−56.3, −22.3] | 10 | VECTOR better |
| K | Ambulance | W4→E4 | 169.110/10 | 170.910/10 | 225.010/10 | 421.610/10 | −1.8 [−28.9, +25.3] | 10 | Not resolved |
| K | Fire engine | N2→S3 | 253.010/10 | 391.010/10 | 474.210/10 | 319.19/10 | −138.0 [−193.0, −83.0] | 10 | VECTOR better |
| K | Police car | E4→W1 | 1571.65/10 | 1552.67/10 | —0/10 | 1576.52/10 | +107.0 [−362.3, +576.3] | 3 | Not resolved |
| O | Ambulance | W4→E4 | 115.510/10 | 176.610/10 | 172.010/10 | 196.810/10 | −61.1 [−76.7, −45.5] | 10 | VECTOR better |
| O | Fire engine | S2→N2 | 149.810/10 | 214.610/10 | 198.110/10 | 298.98/10 | −64.8 [−85.5, −44.1] | 10 | VECTOR better |
Paired differences use only seeds where the vehicle arrived under both arms, so K’s police comparison rests on 3 pairs and is not resolved.
Scenario K: priority could not get the police car through
Current limitationIn the saturated scenario K the police car reached its destination in 5 of 10 runs under VECTOR, against 7 of 10 under native control. VECTOR kept issuing priority decisions for it, but a green light cannot move a vehicle through a gridlocked downstream link, and VECTOR has no routing to send it around the jam. Not every emergency vehicle benefits: in the same scenario the ambulance’s difference is not resolved.
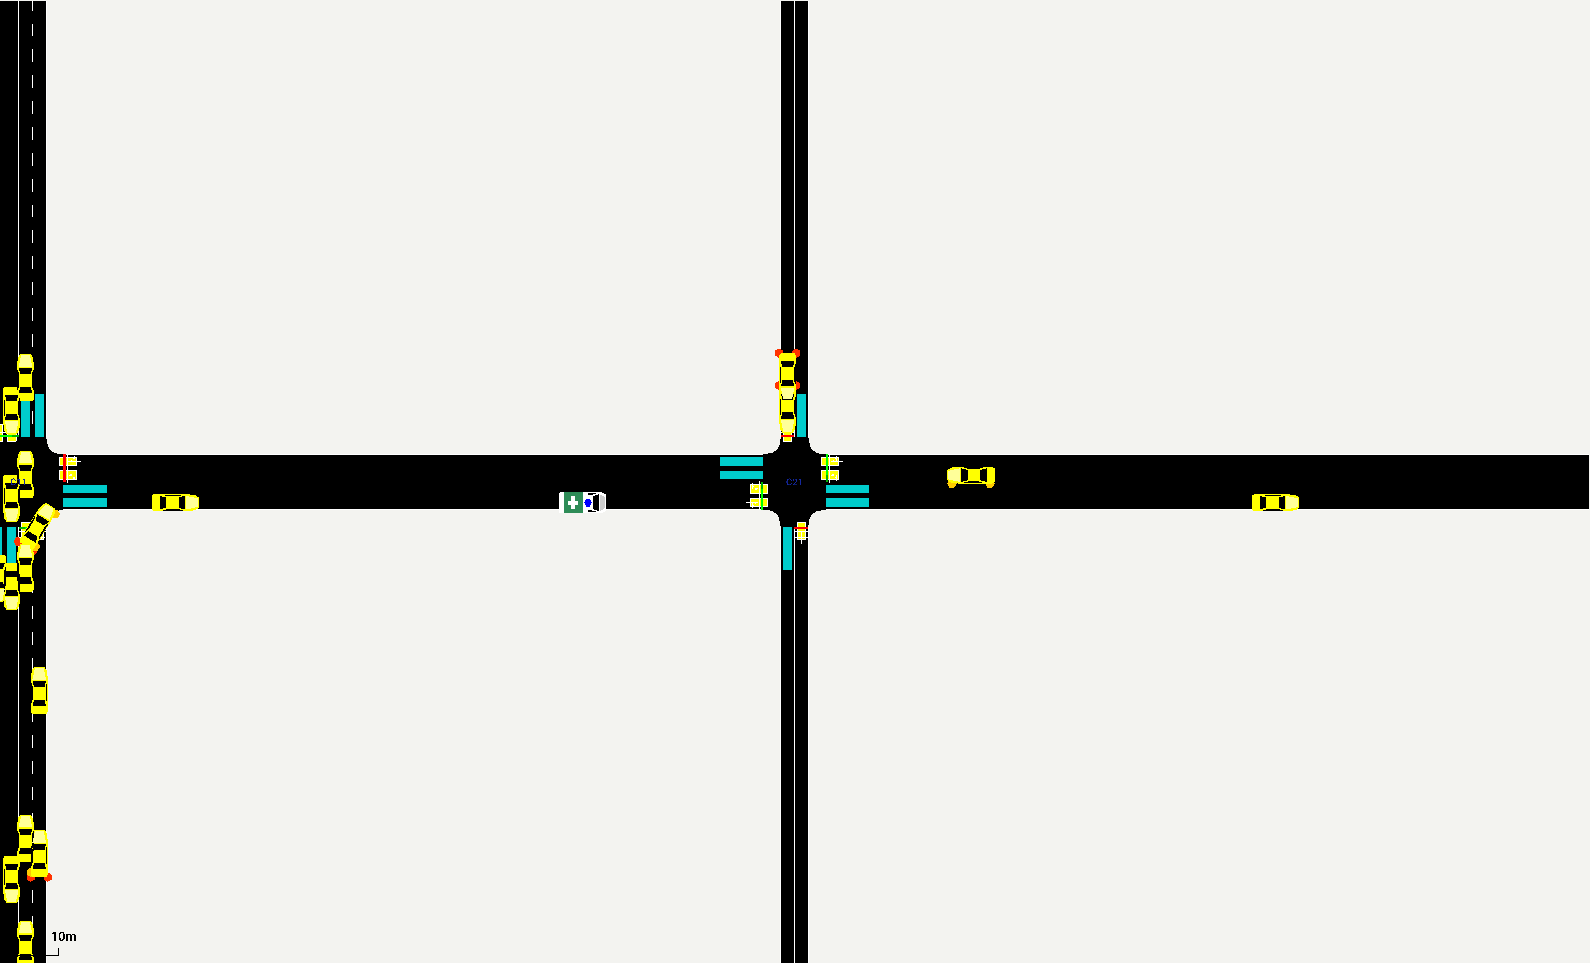
E10ambulance amb1 (white, eastbound on row 1) approaching C21; the decision record beside it shows whether VECTOR gave its approach priority
sumo-gui screenshot · scenario C · arm vector · seed 95000 · simulated time 947 s
Full resolution · 1590×963 PNG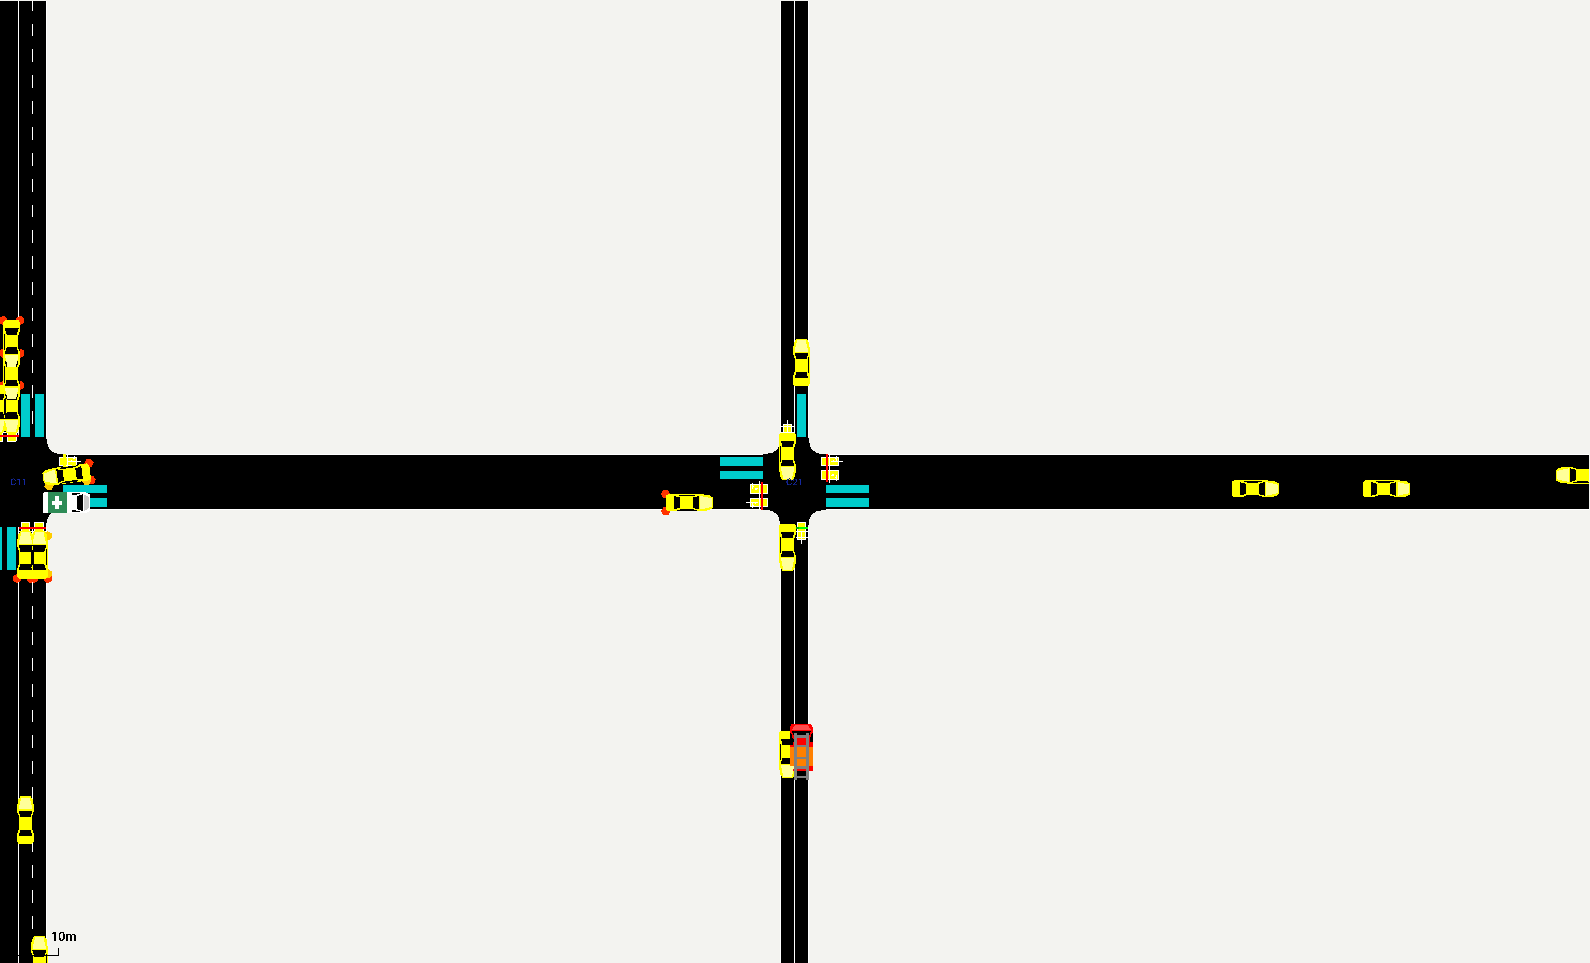
E12C21 as the ambulance (EW) and the fire engine (NS) converge on conflicting approaches
sumo-gui screenshot · scenario D · arm vector · seed 95000 · simulated time 938 s
Full resolution · 1590×963 PNG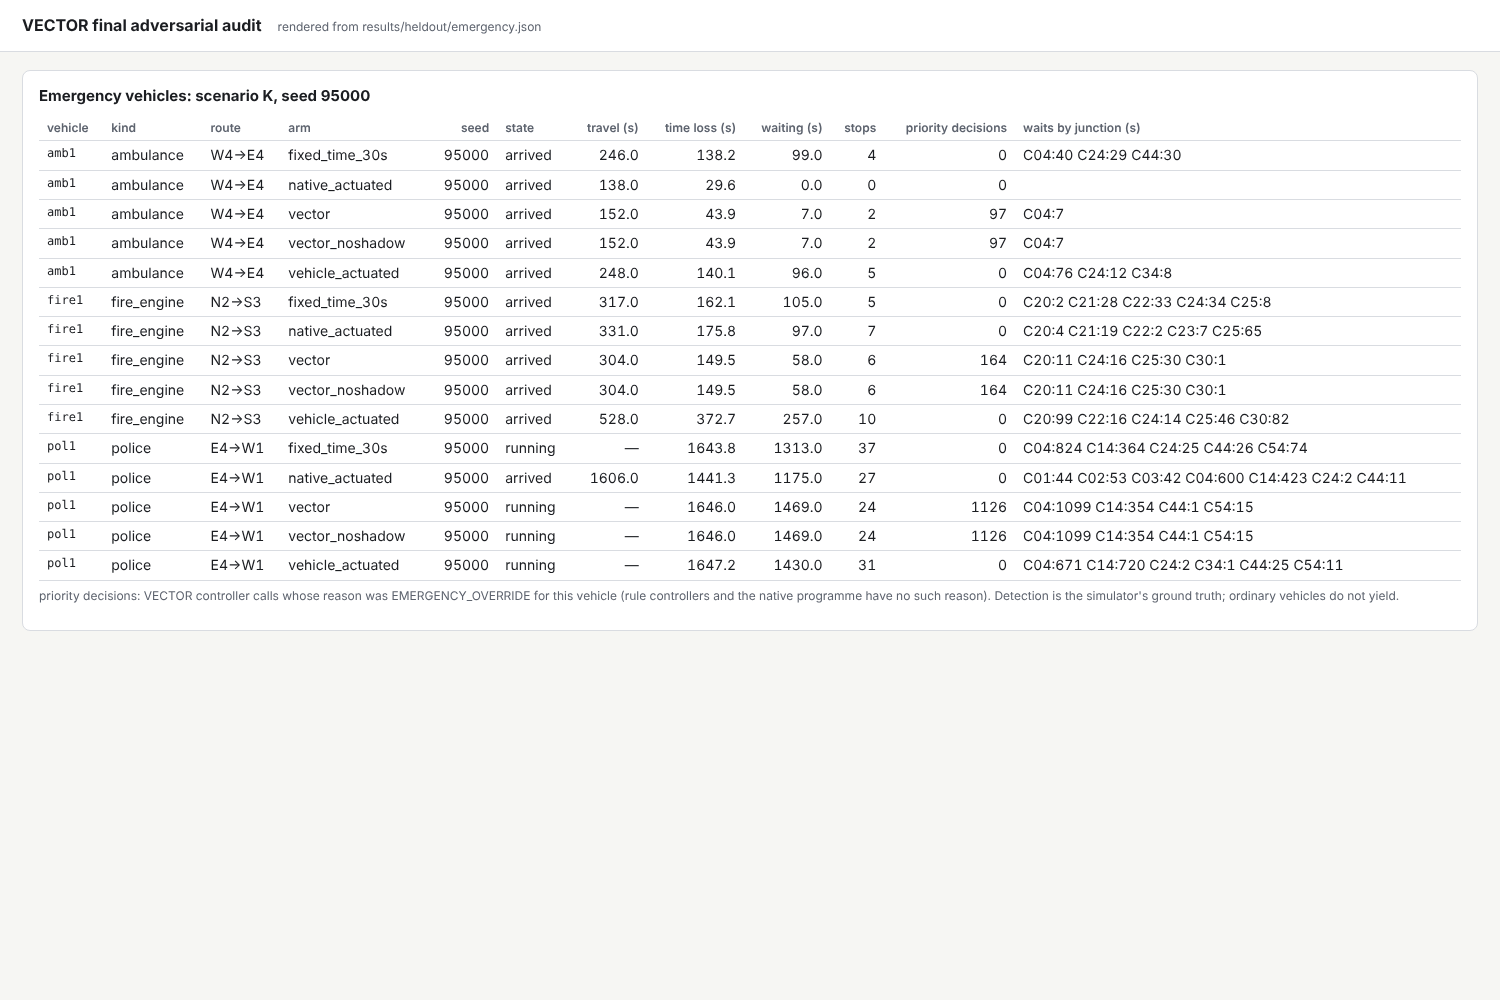
E26Scenario K, seed 95000: three emergency vehicles in a saturated network
audit dashboard rendering of recorded results · scenario K · seed 95000
Full resolution · 1500×1000 PNGFailure analysis
Why VECTOR loses where it loses.
VECTOR loses to native control mainly in the congestion scenarios, where queues stop discharging because a downstream link is full or blocked. The findings below say what was observed, what is a structural limitation, and what is an exploratory explanation.
- 01
Green is held on queues that cannot discharge
VerifiedIn scenario I, vehicles stalled at the stop line block both lanes of the approach to junction C41. VECTOR serves that approach green for the full 45 s, then serves it again after clearance, while the queue grows from 29 to 34 vehicles and the cross street waits. Its own reason string labels the queue “discharging”.
- 02
Across the audit, the time-loss gap tracks ineffective green
ExploratoryAcross the 160 paired held-out cells, VECTOR’s excess time loss over native actuated control correlates with its excess ineffective green (r = 0.906) and wasted green (r = 0.917). This is exploratory evidence consistent with the mechanism above. A correlation across cells is not proof of causation.
- 03
The decision law has no downstream or discharge term
Current limitationThe law ranks approaches by the number of halting vehicles. A queue behind a blocked downstream link therefore looks like demand. SUMO’s native actuated controller ends green when its detectors see no vehicle crossing, so it yields a blocked approach early; VECTOR has no equivalent signal.
- 04
No coordination between junctions
Current limitationThe 36 junctions run 36 independent controller instances, with no shared state and no offsets. A corridor result is the sum of local decisions.
Evidence: E09
- 05
The queue observer lags the true queue
VerifiedThe observer limits every change in its queue estimate to ±0.5 vehicles per second. That absorbs phantom sensor spikes, and it also delays real changes. On the trace seed its estimate was off by five or more vehicles in 3.2% of approach-decisions in R0, 6.0% in B, 8.2% in J and 10.1% in L.
Evidence: E04
- 06
Forecasting is worse than persistence, and has no influence
VerifiedThe shadow forecasting stack’s error at an 8 s horizon is worse than simply repeating the current reading in 15 of 16 scenarios, on every seed of each. In scenario H its error rises from 1.254 to 2.601 vehicles after the demand shift. The signal sequence with and without the shadow stack is identical in 160 of 160 paired trials: it influences nothing.
- 07
The safety interlock that was tested is the harness’s, not VECTOR’s
Current limitationZero timing violations, illegal states or invalid requests were recorded, but the timing rules were enforced by the audit harness’s signal adapter. VECTOR’s own
SignalSafetyGovernorwas not in the path, so the audit does not validate it. - 08
Corrupted input is not detected
VerifiedWith approaches swapped and readings delayed by 10 s (scenario L), VECTOR served the wrong approach: at C44, 32–42 vehicles queued on one approach while VECTOR, shown them on the other, extended that green to its maximum. Nothing in VECTOR checks observations for consistency.
Evidence: E23
- 09
The advisory stack misreports its own health
VerifiedWhen every forecaster failed (scenario M, 900–1500 s), the orchestrator still reported itself fully healthy while producing no forecasts. Control was unaffected only because nothing reads the stack.
Evidence: E19
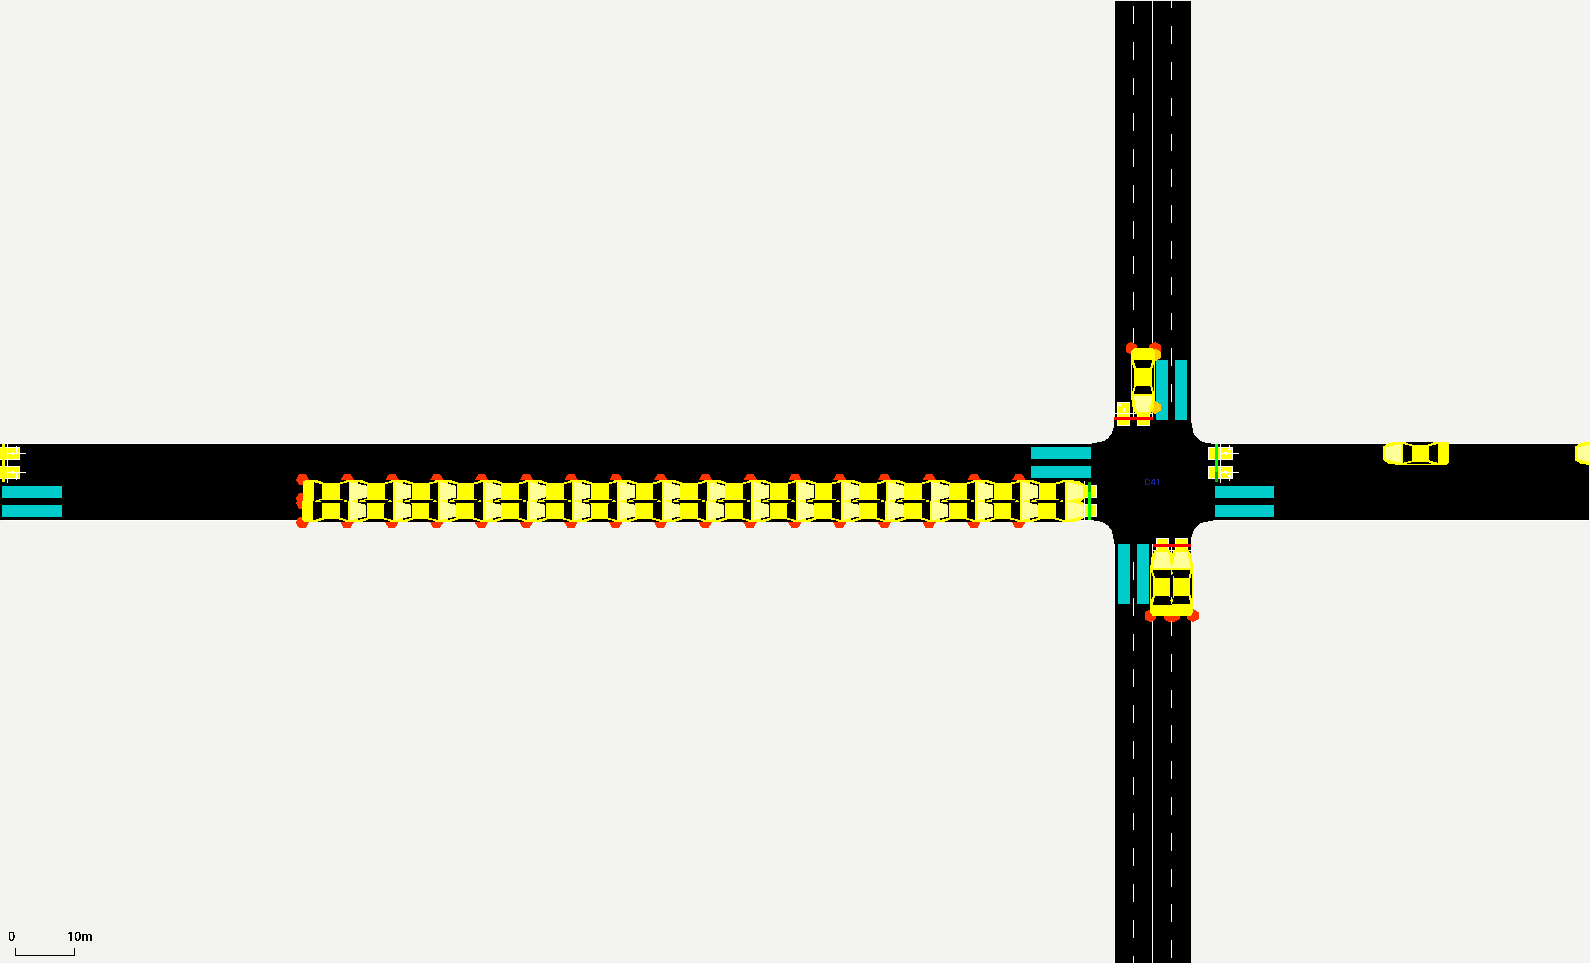
E15C41 at 1291 s, scenario I: both lanes of the C31->C41 approach blocked by vehicles stalled at the stop line since 641/662 s; VECTOR has held EW green for 43 s on a 32-vehicle queue that cannot move (it ends at max green, 45 s, and is re-served)
sumo-gui screenshot · scenario I · arm vector · seed 95000 · simulated time 1291 s
Full resolution · 1590×963 PNG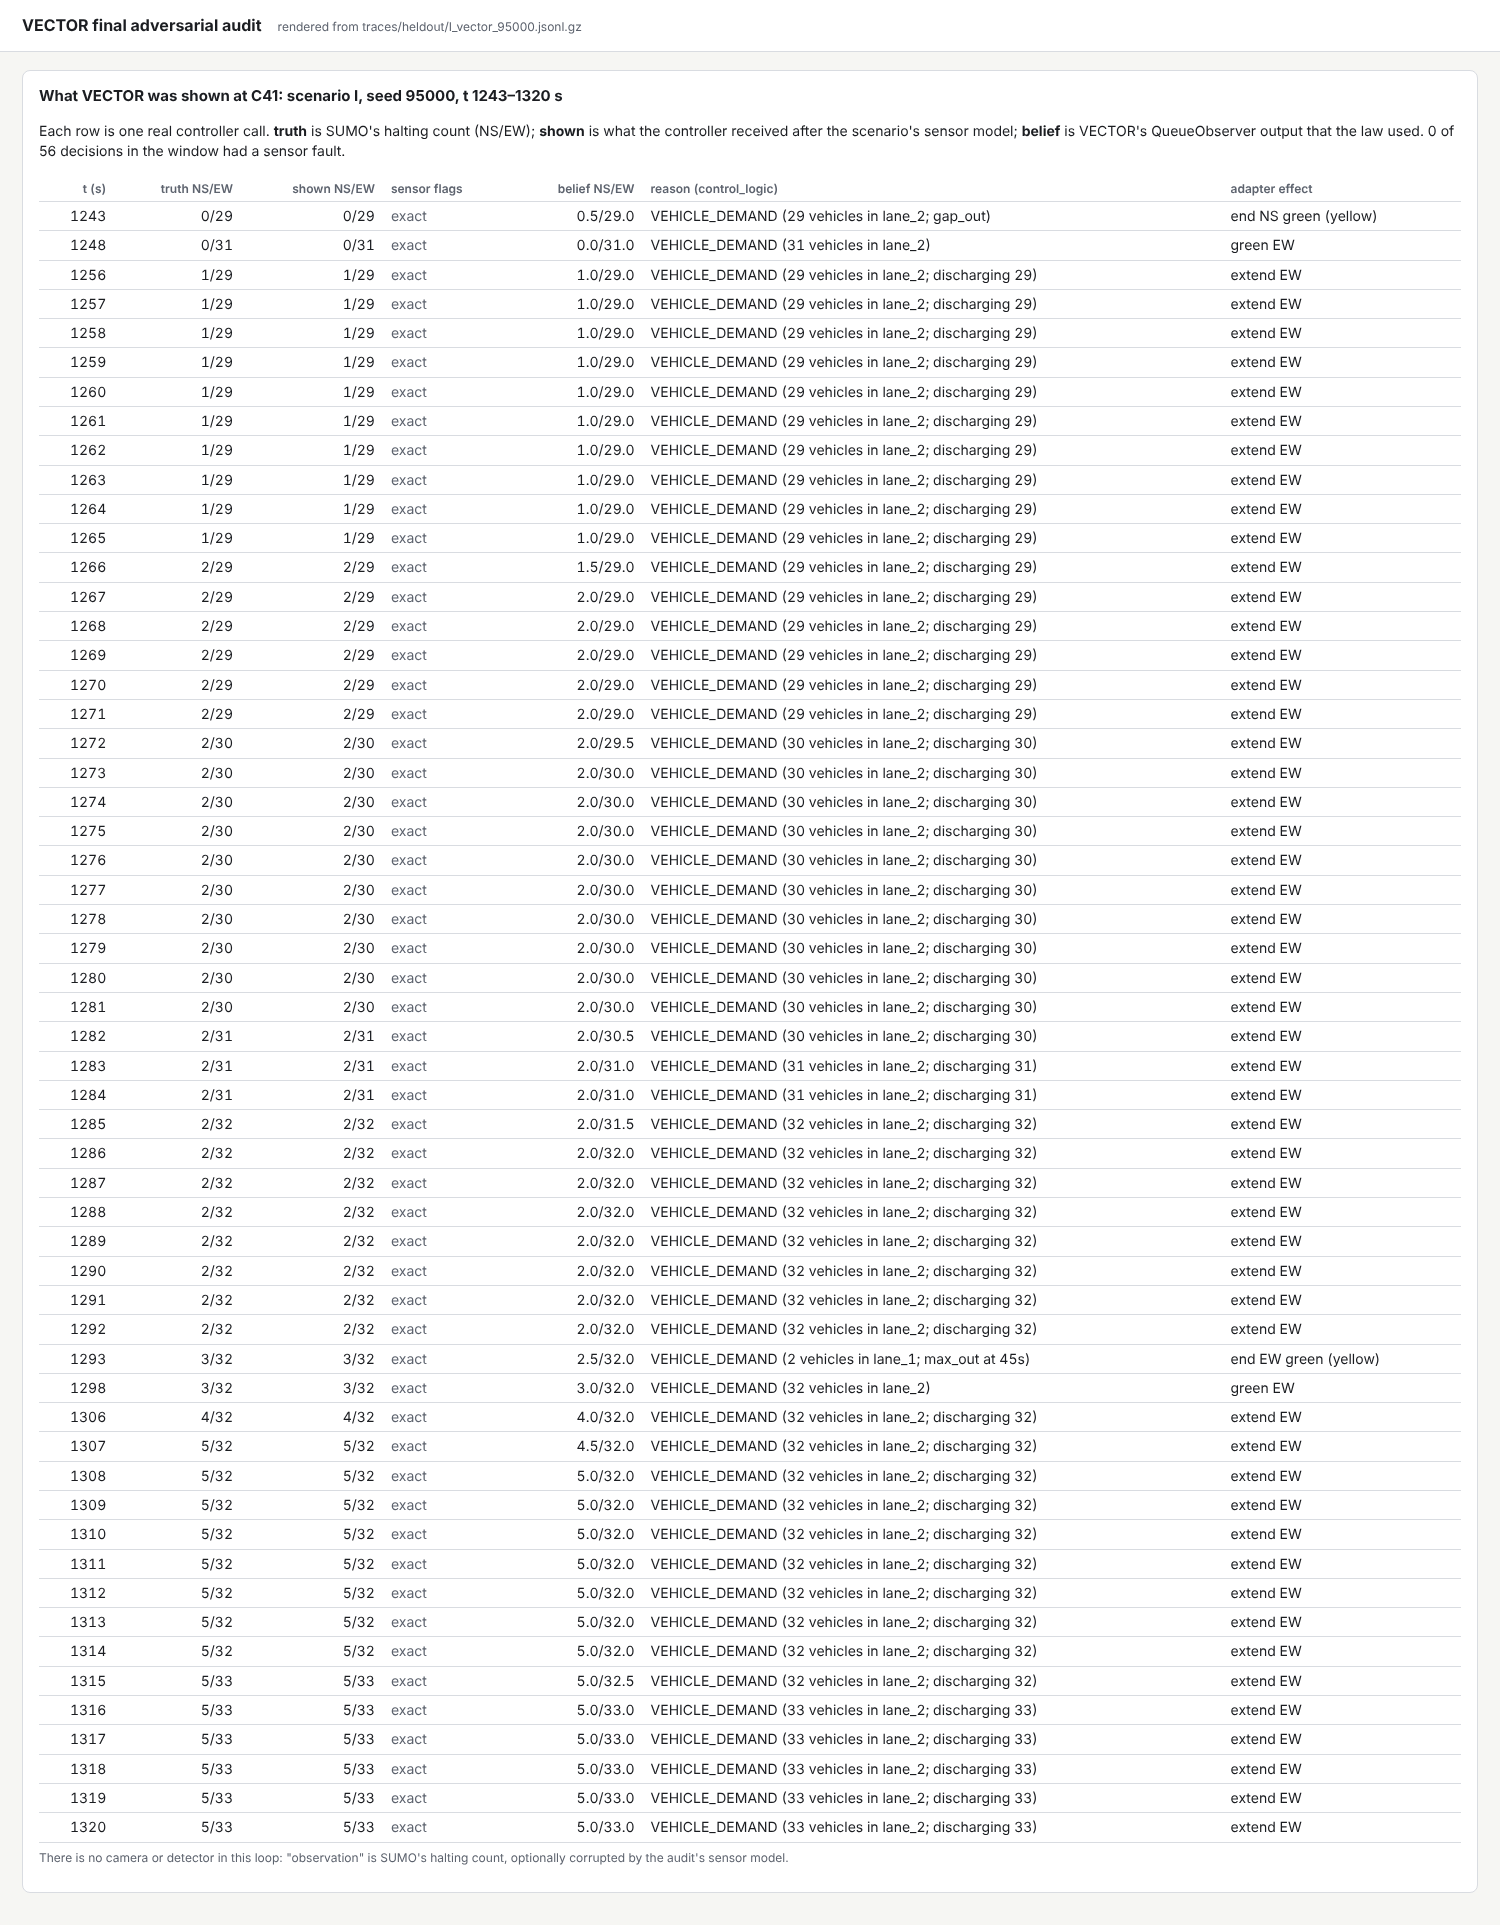
E27Scenario I, junction C41, 1243-1320 s: every decision while both lanes of the C31->C41 approach are blocked at the stop line
audit dashboard rendering of recorded results · scenario I · arm vector · seed 95000 · simulated time 1243 s
Full resolution · 1500×1925 PNGPost-hoc diagnosis · exploratory
Checked after the results were seen, on seeds the evaluation never used.
This is not part of the frozen held-out evaluation. It was designed after the held-out results were known, run on fresh seeds 96000–96009 in five scenarios, with VECTOR unchanged and with two of VECTOR’s own registered ablations. 200 of 200 trials completed. No multiplicity correction is applied, and none of it changes a held-out result.
| Scenario | Held-out | Fresh seeds | Better / worse |
|---|---|---|---|
| R0 | −12.0 [−69.9, +46.0] | +21.1 [+4.3, +37.9] | 1 / 9 |
| B | +73.6 [+26.6, +120.5] | +23.7 [−22.6, +70.0] | 4 / 6 |
| C | +33.1 [+16.3, +49.8] | +17.9 [−1.8, +37.6] | 2 / 8 |
| J | +69.1 [+7.0, +131.2] | +67.0 [+16.9, +117.2] | 2 / 8 |
| K | +111.2 [+67.5, +154.9] | +116.3 [+92.5, +140.2] | 0 / 10 |
| Scenario | No queue observer | No green commitment |
|---|---|---|
| R0 | +16.7 [+8.8, +24.5] | −15.1 [−26.6, −3.7] |
| B | +2.8 [−34.3, +40.0] | +8.9 [−43.0, +60.8] |
| C | +14.2 [+7.0, +21.5] | −17.1 [−27.8, −6.3] |
| J | +13.0 [−27.0, +52.9] | +102.9 [+54.1, +151.7] |
| K | +37.1 [+13.0, +61.3] | +65.6 [+44.3, +86.8] |
Positive means the ablation is worse than VECTOR. Removing the observer hurts where resolved; removing green commitment helps at moderate demand (R0, C) and hurts badly under saturation (J, K). In J and K no variant comes close to native control.
The direction of the held-out result repeats on every re-tested scenario; its size does not always. K and J are stable; B is about a third of its held-out size with an interval that includes zero, so the held-out B magnitude is probably overstated even though its Holm rejection stands as the pre-registered result. The interpretation — that the deficit lies in the control law rather than in either mechanism — is exploratory.
Architecture as implemented
What actually ran in the SUMO control loop.
A module that only writes a log entry is not counted as integrated. These counts come from one real 36-junction trial run with call counters on the control path and a record of every module loaded.
| Module | Role in the loop | Calls (600 s trial) |
|---|---|---|
| QueueObserver (state estimate) | In the loop; the law reads its estimate | 19,274 updates |
| control_logic.decide_signals (decision) | Is the decision | 9,637 calls |
| SignalAdapter (audit harness) | Enforces timing on every decision | 9,637 applications |
| IntelligenceOrchestrator + StateEstimator | Runs in shadow; no influence | 9,637 calls |
| Forecasters (persistence, physics, Kalman, spectral) | Run in shadow; no influence | 9,637 / 3,103 / 3,103 / 3,103 |
Not loaded during the trial at all
Aegis · Anarchy · Atlas · Fusion Engine (Anarchy) · Fusion Engine (perception) · Hyperion · MORL / GNN / causal learning · ORACLE · PULSAR · Perception adapter / detector path · Phoenix · Punisher · Sentinel · Serpentine (protocol) · Serpentine (routing: DynamicRouter, pathfinding) · SignalSafetyGovernor · Temporal (sequence) inference · Terminus
Does not exist in the repository
Decision Memory Engine
Reproducibility and integrity
How to check this, and what was checked.
Release date 26 October 2026. Audit snapshot: branch claude/vector-extremis-forensic-audit-f5vtxg, commit f8e863f. The engineering repository is private; the files that every figure here is generated from are published on this site.
- Frozen protocol
- Committed at 63bc12a before any held-out seed ran; the held-out runner refused an uncommitted tree (recorded clean: yes). Held-out results committed at 8c72db6.
- Trial records
- Every attempt of all 800 held-out trials is logged (attempts.jsonl, published); per-trial summaries and decision traces stay in the engineering repository. The per-trial table behind every comparison is published as trials.csv.
- Shadow non-influence
- Signal sequences identical with and without VECTOR’s shadow stack in 160 of 160 paired held-out trials.
- Evidence integrity
- 27 of 27 screenshots re-hashed against the evidence manifest when this page was built. All 14 sumo-gui images come from GUI runs whose signal-sequence hash and mean time loss equal the headless trial’s.
- Reproduction check
- 8 held-out trials across all five arms re-run at 8558862: every control, traffic, safety and emergency field identical in 8 of 8. Only the shadow’s forecast scoring varied slightly (1–2 forecasts in about 50 000), because its compute budget is wall-clock.
- Continuous integration
- GitHub Actions “validate” on f8e863f: run #151 (push) success, run #152 (pull request) success.
Environment
- SUMO 1.28.0 through TraCI (installed from
requirements-sumo.txt) - Python 3.11, numpy 2.4, scipy 1.17; Ubuntu 24.04
- xvfb-run for the sumo-gui evidence; Chromium with Playwright for the dashboard captures and the PDF
- Reference machine: 4 vCPUs, 15 GB RAM. The held-out run took 1.6 h with 4 workers.
Commands (engineering repository)
# every stage, in order, each logged
python audit/final_adversarial/run_audit.py

# the held-out evaluation alone
python audit/final_adversarial/run_suite.py --phase heldout \
  --seeds 95000-95009 --trace-seed 95000 --workers 4
python audit/final_adversarial/analyze.py --phase heldout
The full command list and the reproduction notes are in section 10 of the dossier.
Evidence
27 genuine screenshots, each tied to the run that produced it.
Simulator screenshots were taken by sumo-gui over TraCI during held-out trials on seed 95000; dashboard screenshots render recorded result files. None is drawn, edited, cropped or composited, and each original is published unaltered with its SHA-256. Several planned captions did not match the captured state and were corrected from the recorded data before release; the corrected captions are the ones shown.
E01city36, all 36 signalised junctions (C00-C55), VECTOR controlling every one, t=301 s
sumo-gui screenshot · scenario A · arm vector · seed 95000 · simulated time 301 s
Full resolution · 1590×963 PNGE15C41 at 1291 s, scenario I: both lanes of the C31->C41 approach blocked by vehicles stalled at the stop line since 641/662 s; VECTOR has held EW green for 43 s on a 32-vehicle queue that cannot move (it ends at max green, 45 s, and is re-served)
sumo-gui screenshot · scenario I · arm vector · seed 95000 · simulated time 1291 s
Full resolution · 1590×963 PNGE10ambulance amb1 (white, eastbound on row 1) approaching C21; the decision record beside it shows whether VECTOR gave its approach priority
sumo-gui screenshot · scenario C · arm vector · seed 95000 · simulated time 947 s
Full resolution · 1590×963 PNG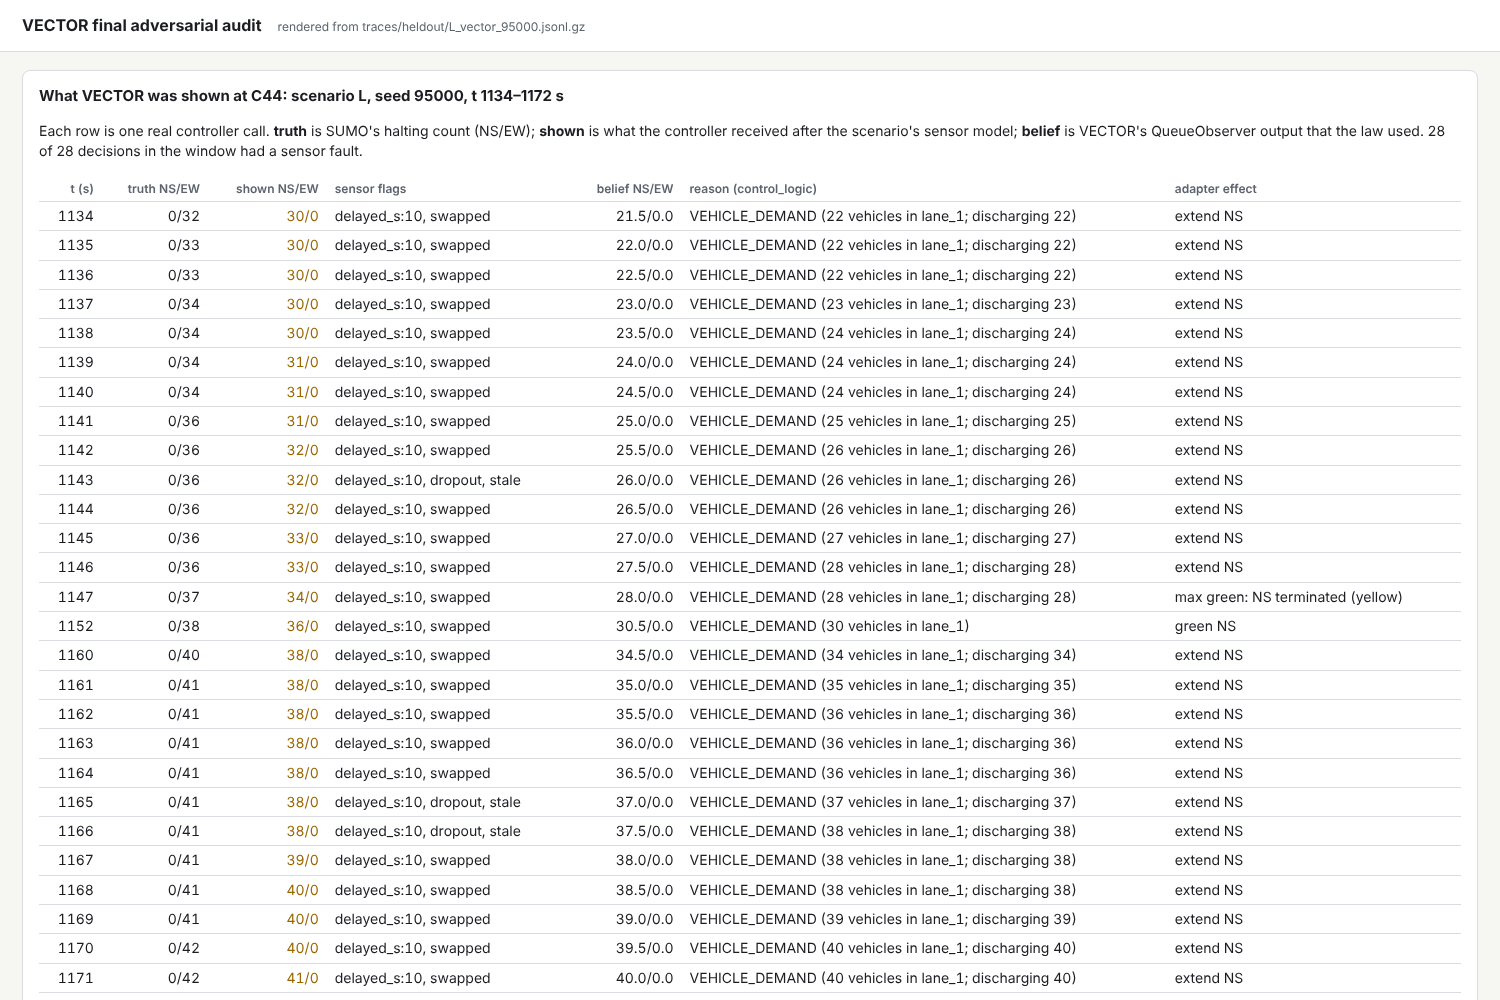
E23Scenario L, junction C44 (approaches swapped), t 1134-1172 s: stale (10 s delayed), contradictory, dropped and invalid observations
audit dashboard rendering of recorded results · scenario L · arm vector · seed 95000 · simulated time 1134 s
Full resolution · 1500×1000 PNG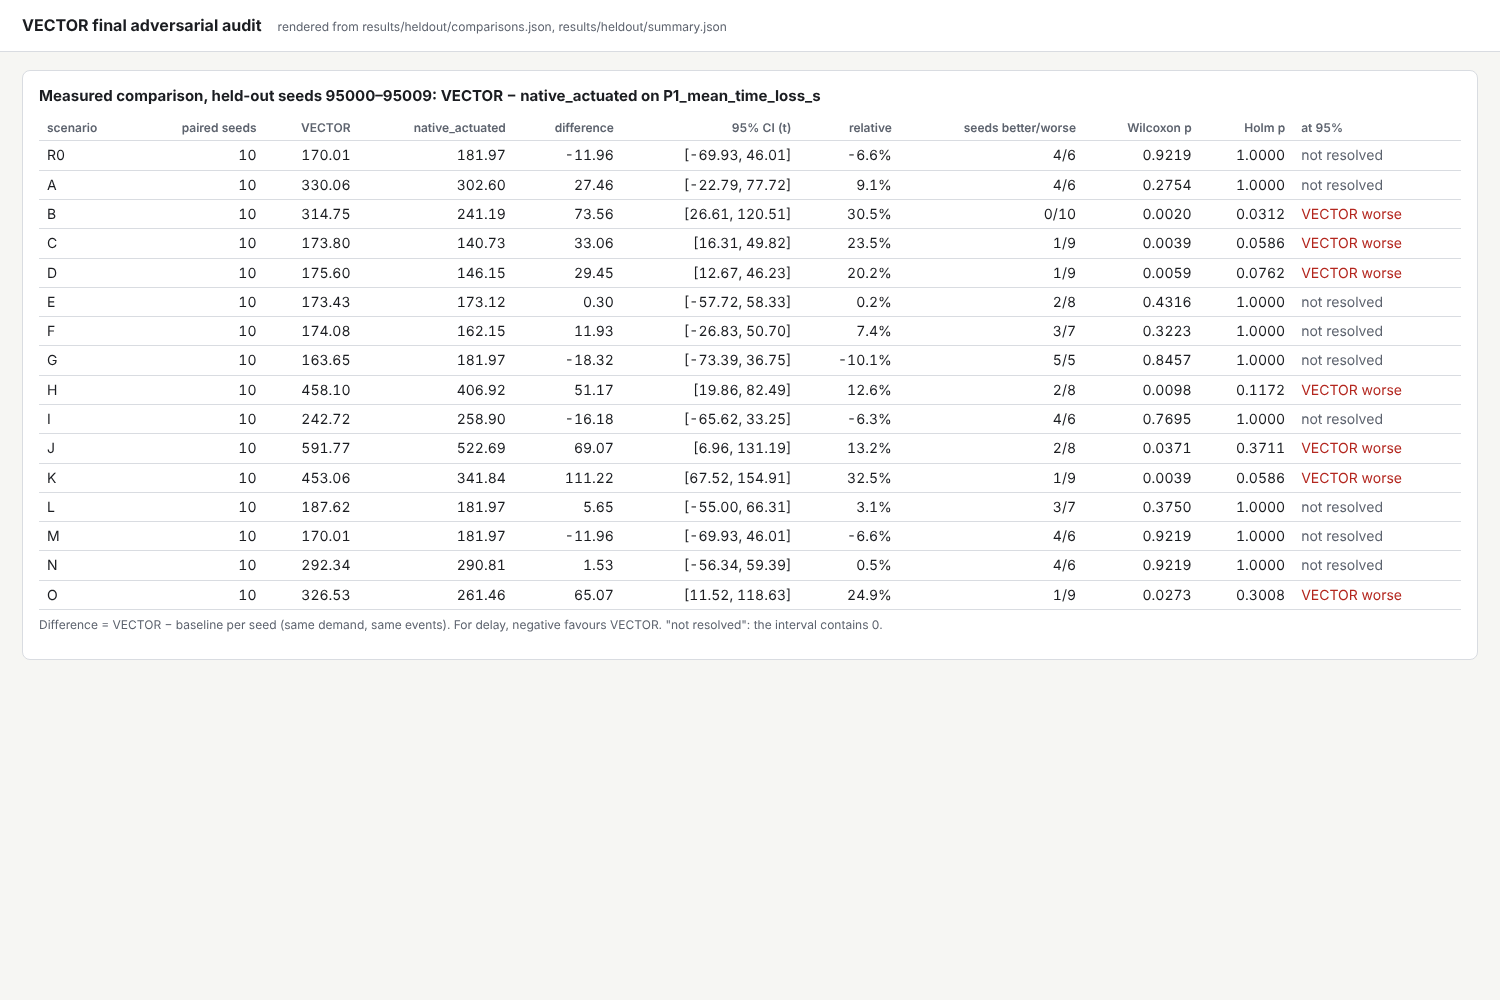
E17Primary endpoint on the held-out seeds: VECTOR minus SUMO's native actuated control, per scenario, paired 95% t-intervals; the coloured label is the unadjusted interval, the Holm column is the family-wise test (only B rejects)
audit dashboard rendering of recorded results
Full resolution · 1500×1000 PNG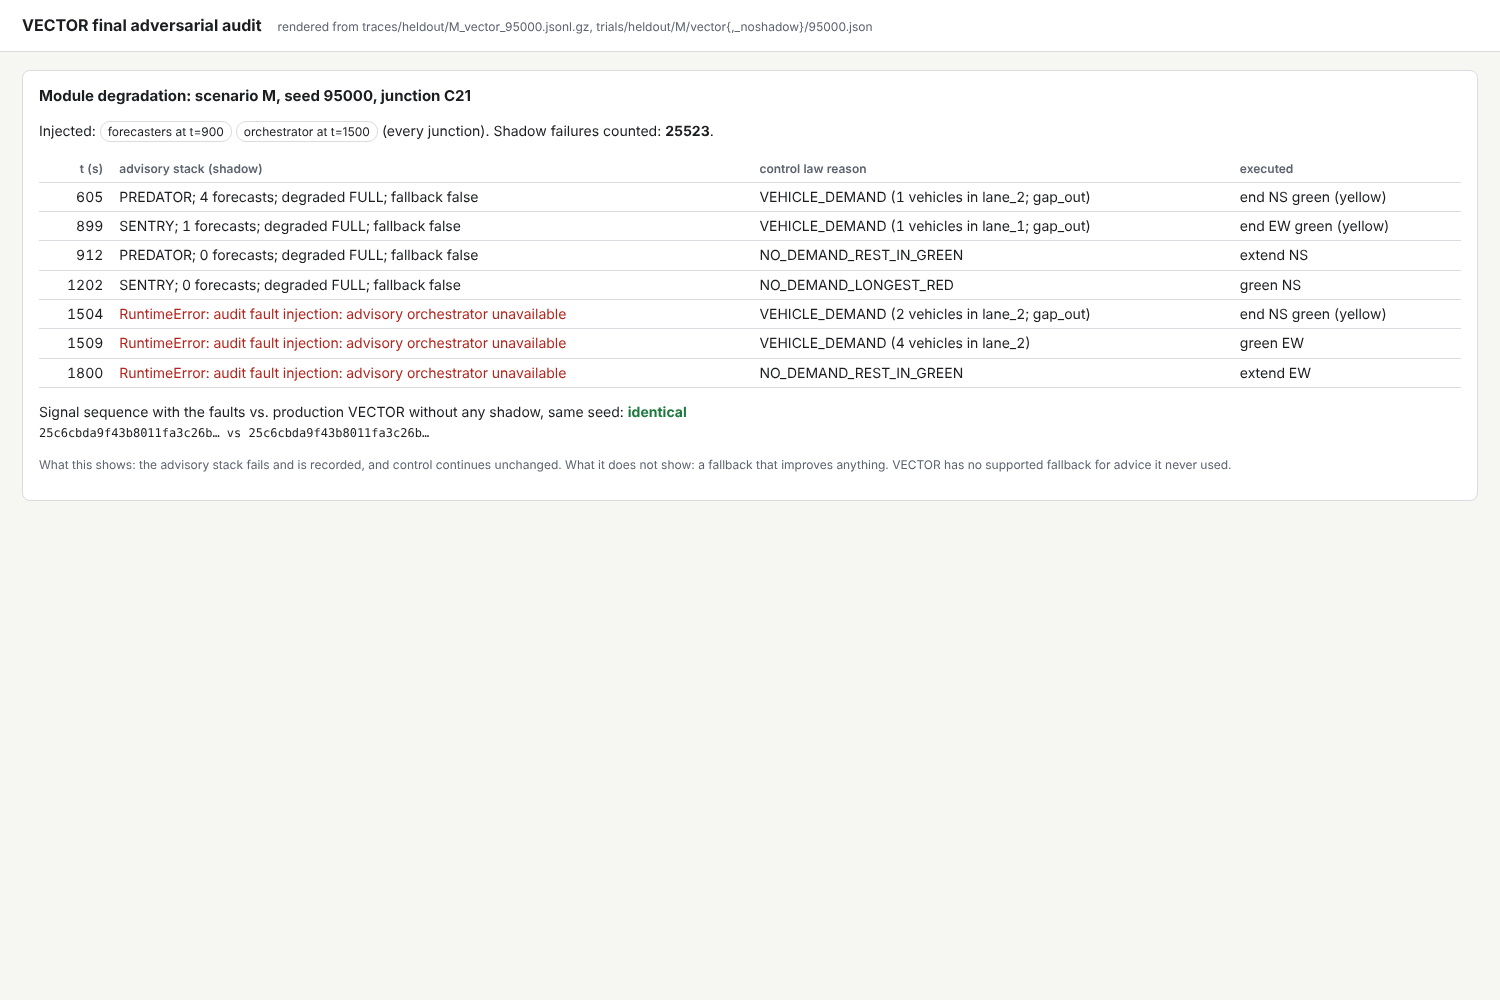
E19Scenario M: forecasters fail at 900 s, the whole advisory orchestrator at 1500 s; control continues unchanged
audit dashboard rendering of recorded results · scenario M · arm vector · seed 95000
Full resolution · 1500×1000 PNGDocuments and data
The dossier, the protocol, and the files behind every figure.
Each file is copied byte for byte from audit commit f8e863f. Sizes and hashes are those of the published file. Further integrity records (harness equivalence, module inventory, the topology report, the collision’s SUMO log, the diagnosis data) are listed in the release manifest.
- Final dossier (PDF, 58 pages)
The complete technical report: architecture, methodology, every result, failure analysis, limitations, readiness, reproduction, results tables, diagnosis and the evidence gallery.
3.3 MB · sha256 e3ce067aec4a…
- Final dossier — Markdown source
The source the PDF is rendered from.
52 KB · sha256 03f05a3935bf…
- Audit protocol
Frozen before the held-out run; section 13 (post-hoc diagnosis) was added after it and says so.
14 KB · sha256 dc2f391d5ae2…
- Held-out results tables
Tables T1–T9, generated from the result files.
22 KB · sha256 e1f80505dbb0…
- Post-hoc diagnosis
Exploratory: replication, ablations, mechanism checks.
7 KB · sha256 b1cf3439c22a…
- Evidence gallery (Markdown)
Every screenshot’s caption, claim, limitation and hash. Its image paths refer to the engineering repository’s layout; the images are on this site.
28 KB · sha256 dfae6afda82c…
- Control-cycle trace schema
Field glossary for the per-decision traces.
4 KB · sha256 aea8adfa95af…
- Scenario definitions
Every scenario’s parameters and configuration hash.
14 KB · sha256 4ea9e8704e2c…
- Evidence manifest
The authoritative record of each screenshot: run, scenario, seed, time, caption, claim, limitation, hash.
105 KB · sha256 9ad9b9dae1da…
- Paired comparisons
Every endpoint, scenario and baseline: means, differences, t and bootstrap intervals, Wilcoxon and Holm.
413 KB · sha256 24d2bc0a0d28…
- Per-trial table
One row per held-out trial: every endpoint, safety counters, latency, signal-sequence hash.
215 KB · sha256 dd837b38d379…
- Emergency vehicles
Per vehicle and run, and the paired travel-time comparisons.
338 KB · sha256 a0cb358bb8a5…
- Attempt log
Every held-out attempt with its outcome and the commit it ran at.
202 KB · sha256 553007faaa98…
- Reproduction check
Eight held-out trials re-run and compared field by field.
4 KB · sha256 66de92ab60fe…
- Release manifest
Every file on this release: its source path in the engineering repository, size and SHA-256, and the display derivatives made from the images.
Research roadmap
Proposed work, in dependency order. None of it is done.
- 01
Downstream blockage and discharge awareness
Give the decision law a term for whether a served queue is actually moving, and for downstream occupancy, so it stops holding green on traffic that cannot leave.
Proposed - 02
Reduce queue-estimation lag
Rework the queue observer so it rejects implausible jumps without trailing real queue growth and discharge by ten or more vehicles.
Proposed - 03
Improve or replace the forecasting stack
Keep a forecaster only if it measurably beats persistence and measurably improves control; otherwise remove it from the path, including its latency.
Proposed - 04
Test changes on new, pre-registered seeds
Every modification motivated by this audit is evaluated on seeds that no earlier step has used, under a protocol frozen before the run.
Proposed - 05
Evaluate junction coordination
Measure whether shared state or offsets between neighbouring junctions help, against the same baselines.
Proposed - 06
Calibrate a simulation on a partner’s historical data
With an approved research partner: build their network, calibrate demand to their counts, and validate their existing controller before VECTOR runs at all.
Proposed - 07
Independent, offline, shadow-only evaluation
VECTOR runs in shadow beside the partner’s controller on recorded or simulated data, reviewed by the partner’s engineers. No live signals.
Proposed
Research collaboration
Review the evidence. Then, if it holds up, evaluate it independently.
This release is an invitation to researchers in transportation engineering and AI: inspect the protocol and the data, try to break the analysis, and — if the work is worth it — discuss an offline, shadow-only evaluation on your own historical data, with VECTOR running beside your existing controller and your engineers reviewing it.
No university, municipality or transportation agency has reviewed, endorsed or partnered with VECTOR. No pilot has taken place. There is no connection to live public traffic signals, and none is proposed.